The 7 Charts That Explain Why Your Forecasts Kept Breaking in 2025
Instead of a clear upward or downward trend, businesses faced volatility in sentiment, demand, and financial conditions that made linear planning unreliable.


If you spent 2025 revising forecasts, reworking plans, or questioning assumptions that seemed solid just weeks earlier, you were not alone. At Starcycle, we spend a lot of time speaking with founders and small business owners about moments when plans stopped lining up with reality. This post looks at the data behind that experience, without judgment and without spin.
What the numbers show is simple and frustrating at the same time. 2025 was not a year of steady decline or steady recovery. It was a year of reversals. Confidence fell, rebounded, and fell again. Costs cooled while capital stayed tight. Demand signals contradicted each other month to month.
Below are seven charts that explain why forecasting broke down for so many operators in 2025.
What a Zig-Zag Economy Means in Practice
A zig-zag economy is defined by frequent changes in direction across key indicators within a single year. Instead of a clear upward or downward trend, businesses faced volatility in sentiment, demand, and financial conditions that made linear planning unreliable.
The issue was not a lack of data. The issue was that different indicators moved on different timelines and often sent conflicting signals.
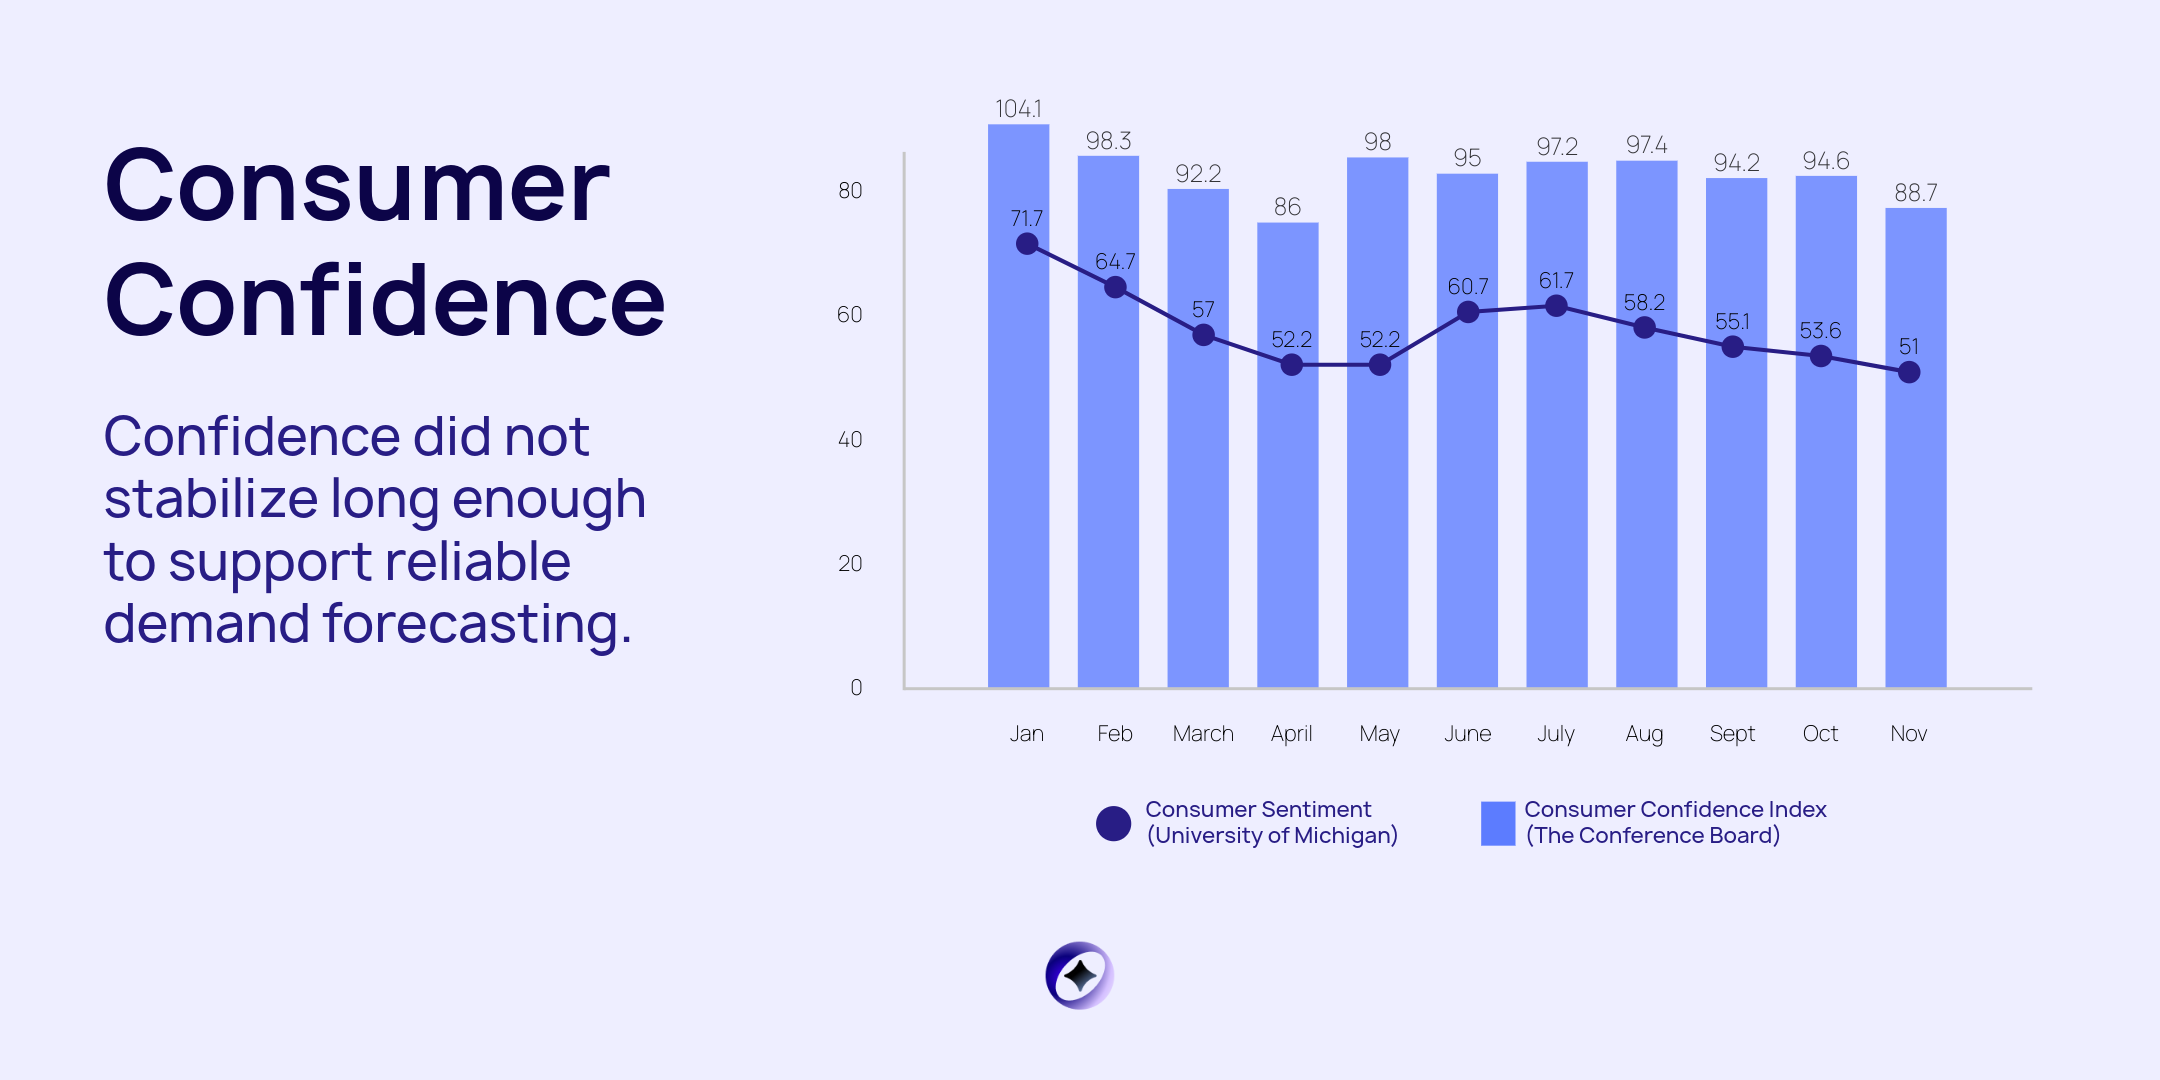
Chart 1: Consumer Confidence Fell, Rebounded, Then Slid Again
At the start of 2025, consumer confidence was relatively strong. In January, the Conference Board Consumer Confidence Index registered at 104.1. By April, it had fallen to 86.0, marking the lowest point of the year.
In May, confidence rebounded sharply to 98.0. That rebound was short-lived. By November, the index had dropped again to 88.7.
This chart matters because consumer confidence influences spending decisions, especially for discretionary purchases. The data shows that confidence did not stabilize long enough to support reliable demand forecasting. Even when confidence improved, it did not remain elevated.
For founders and small business owners, this created false positives. A single strong month looked like a turning point, but it was not sustained.
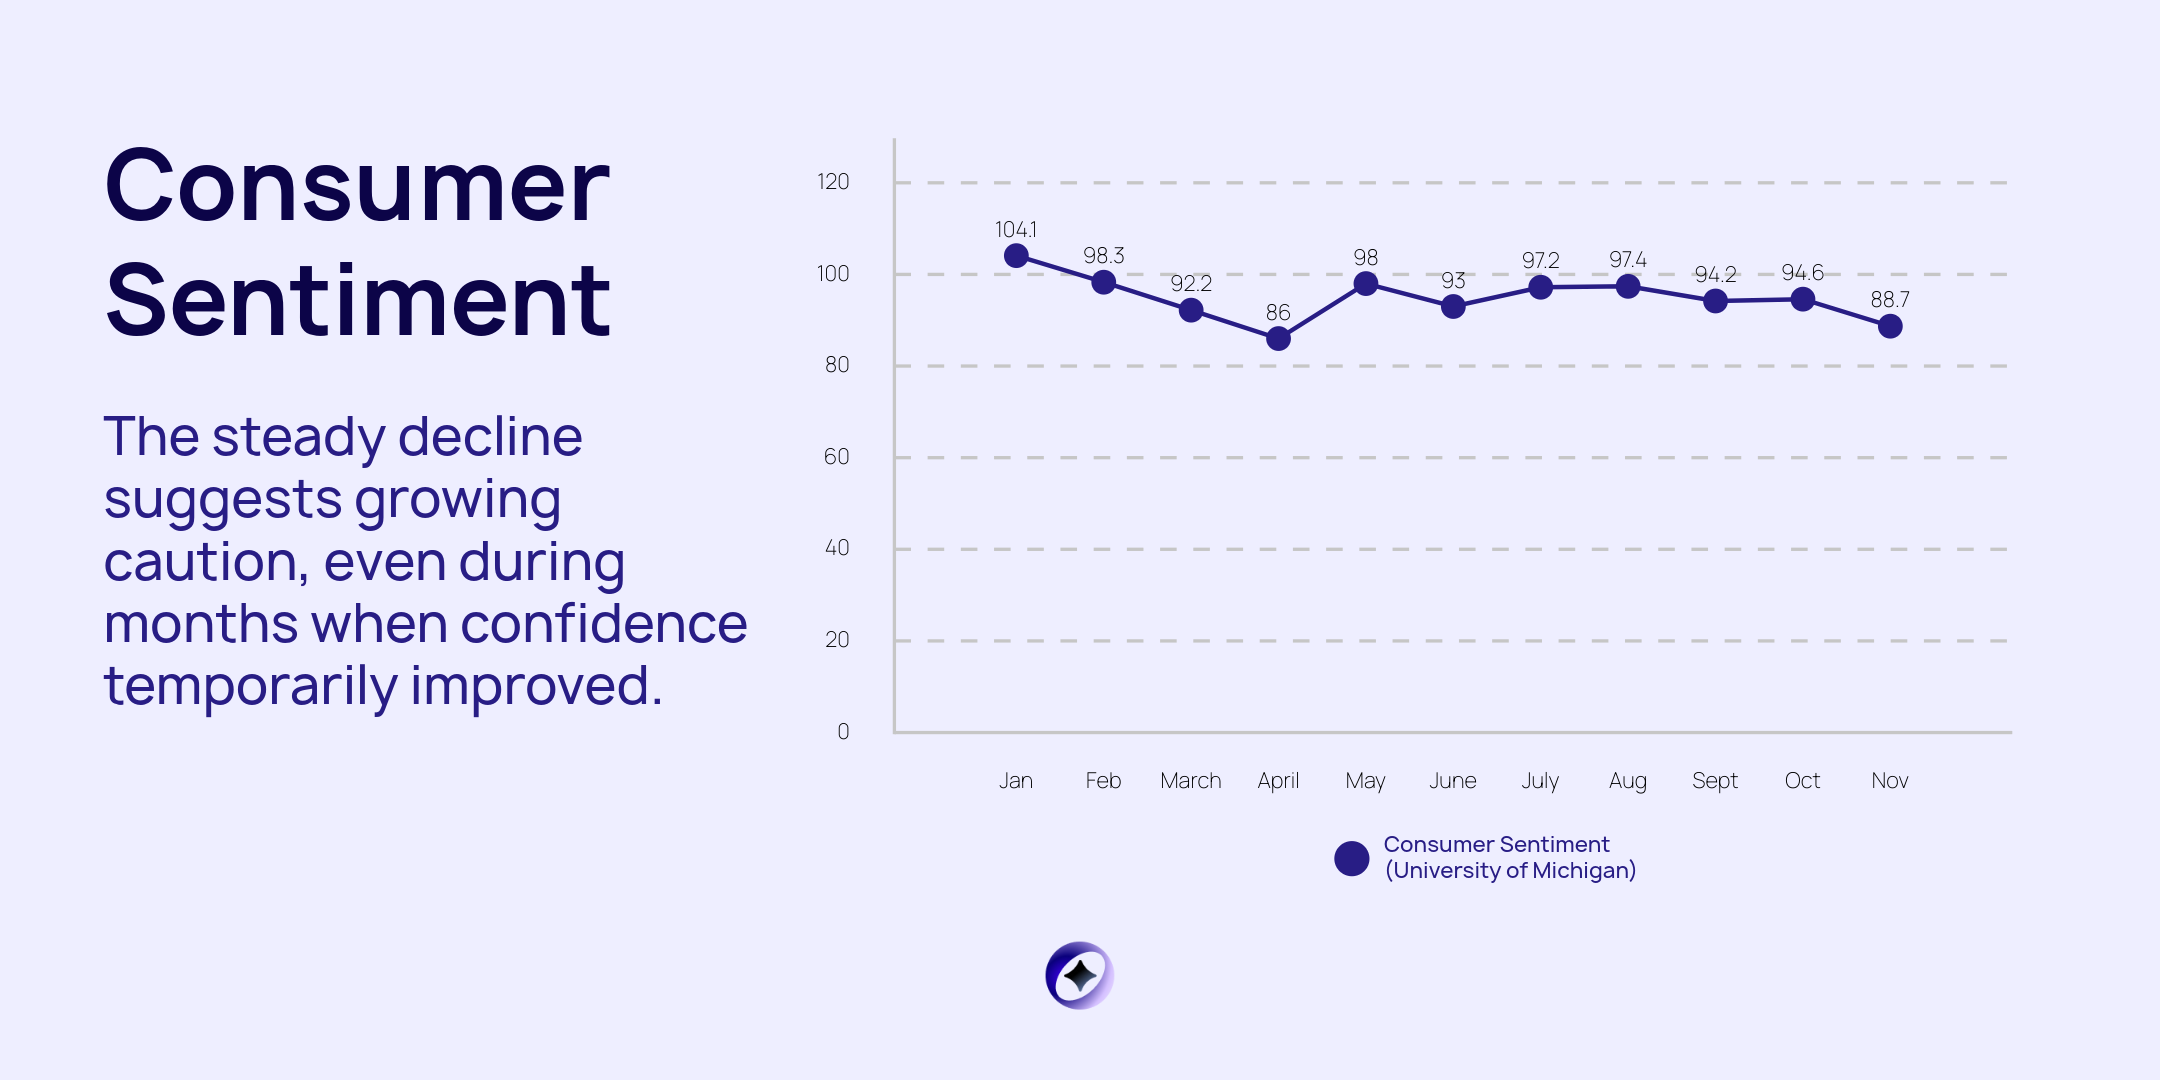
Chart 2: Consumer Sentiment Declined Into Late 2025
While consumer confidence bounced around, consumer sentiment followed a more consistent downward path.
In January, the University of Michigan Consumer Sentiment Index stood at 71.7. By March, it had fallen to 57.0. Sentiment briefly improved midyear but continued to weaken into the fall. In November, it reached 51.0, the lowest level reported in 2025. December showed a modest uptick to 52.9.
Sentiment is a forward-looking indicator. It reflects how consumers feel about their financial prospects and the broader economy. The steady decline suggests growing caution, even during months when confidence temporarily improved.
For businesses, this helps explain why sales cycles lengthened and why customers hesitated, even when pricing or promotions improved.
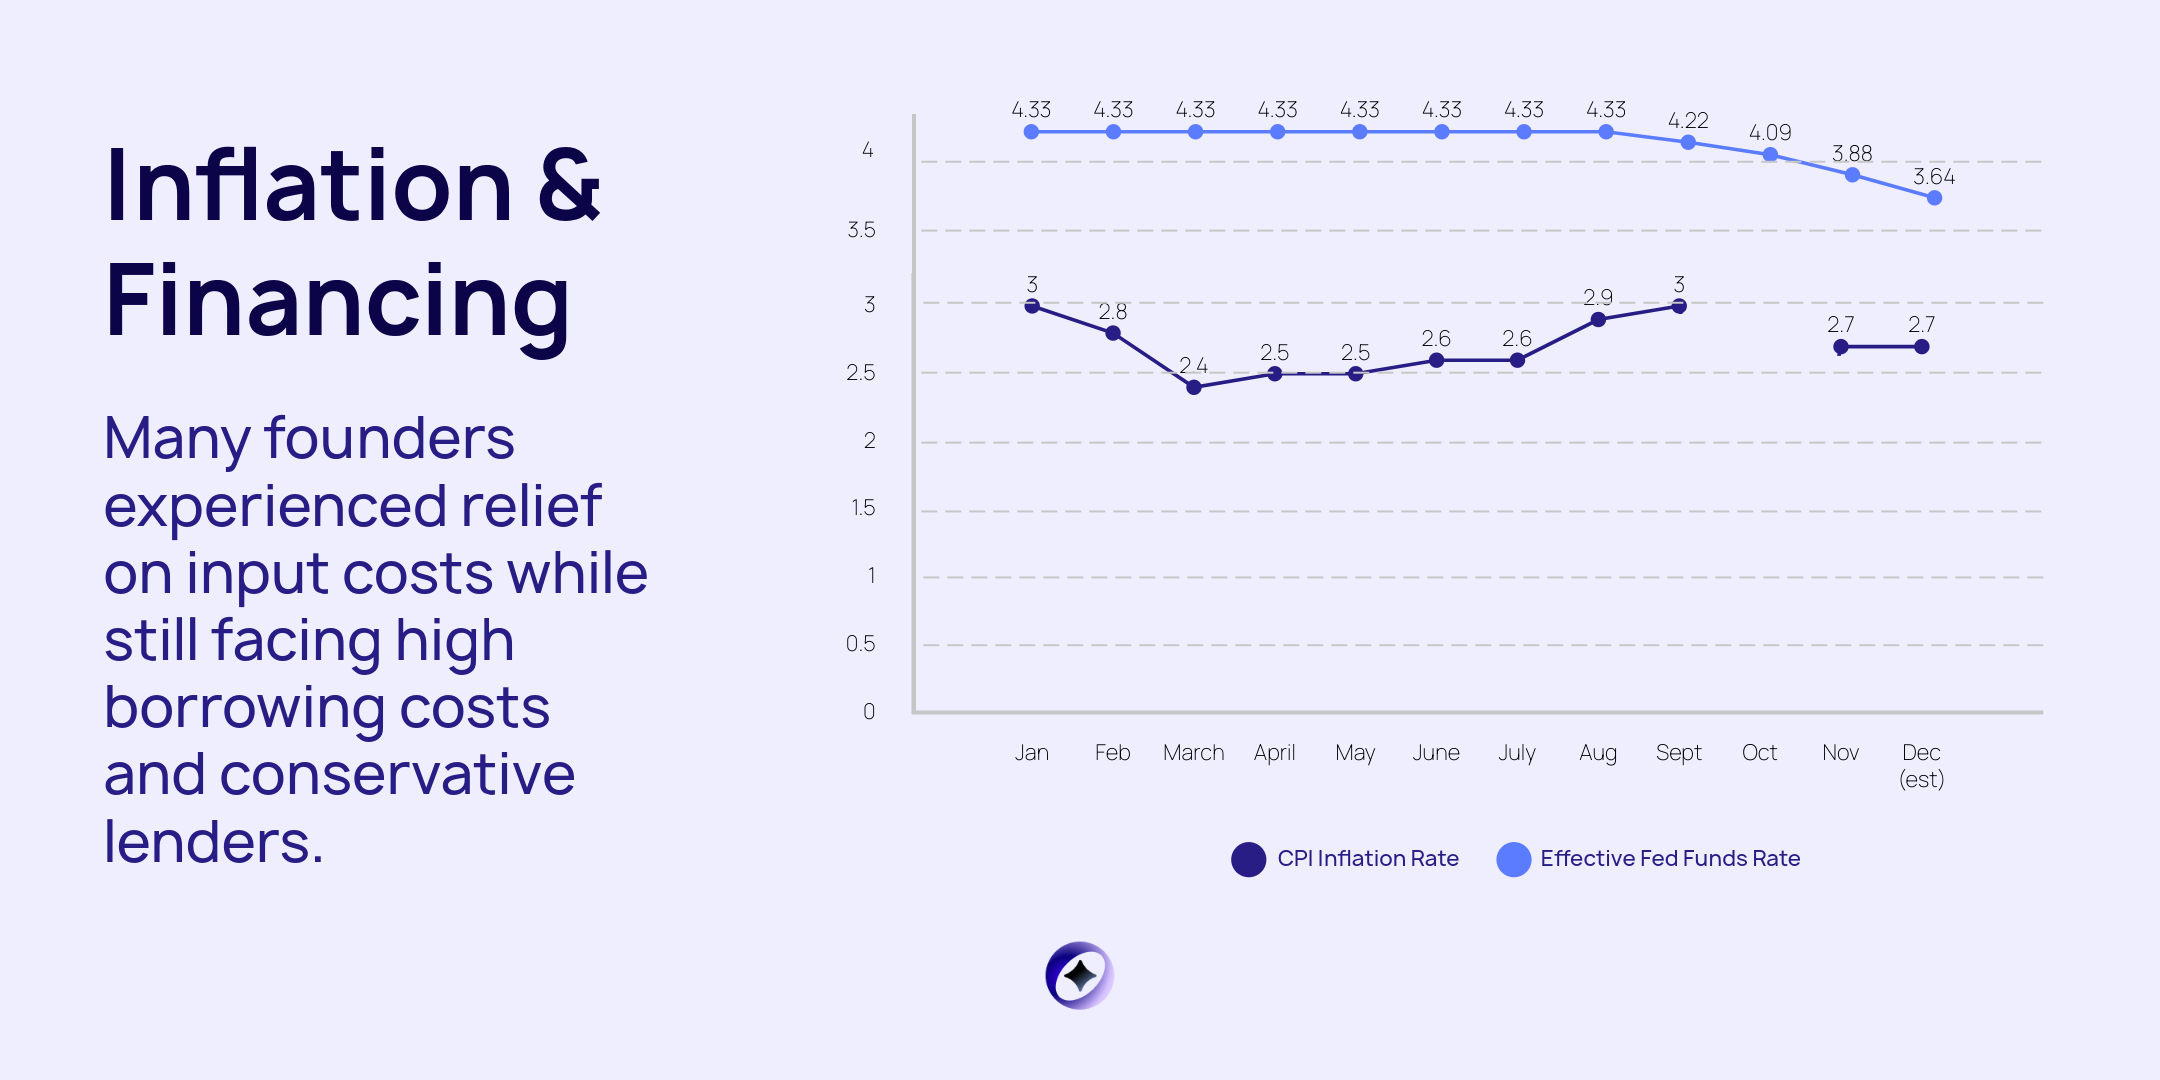
Chart 3: Inflation Moderated Before Financing Conditions Eased
Inflation was not the main problem for most of 2025. CPI inflation moderated from roughly 3.0 percent early in the year to around 2.7 percent by late 2025.
Interest rates told a different story. The effective federal funds rate remained at approximately 4.33 percent from January through August. Cuts began later in the year, bringing the rate down to 3.64 percent by December.
This gap mattered. Operating costs stabilized sooner than access to capital improved. Many founders experienced relief on input costs while still facing high borrowing costs and conservative lenders.
From a planning standpoint, this mismatch made it difficult to decide when to invest, hire, or extend runway. Cost pressure eased, but financing risk remained.
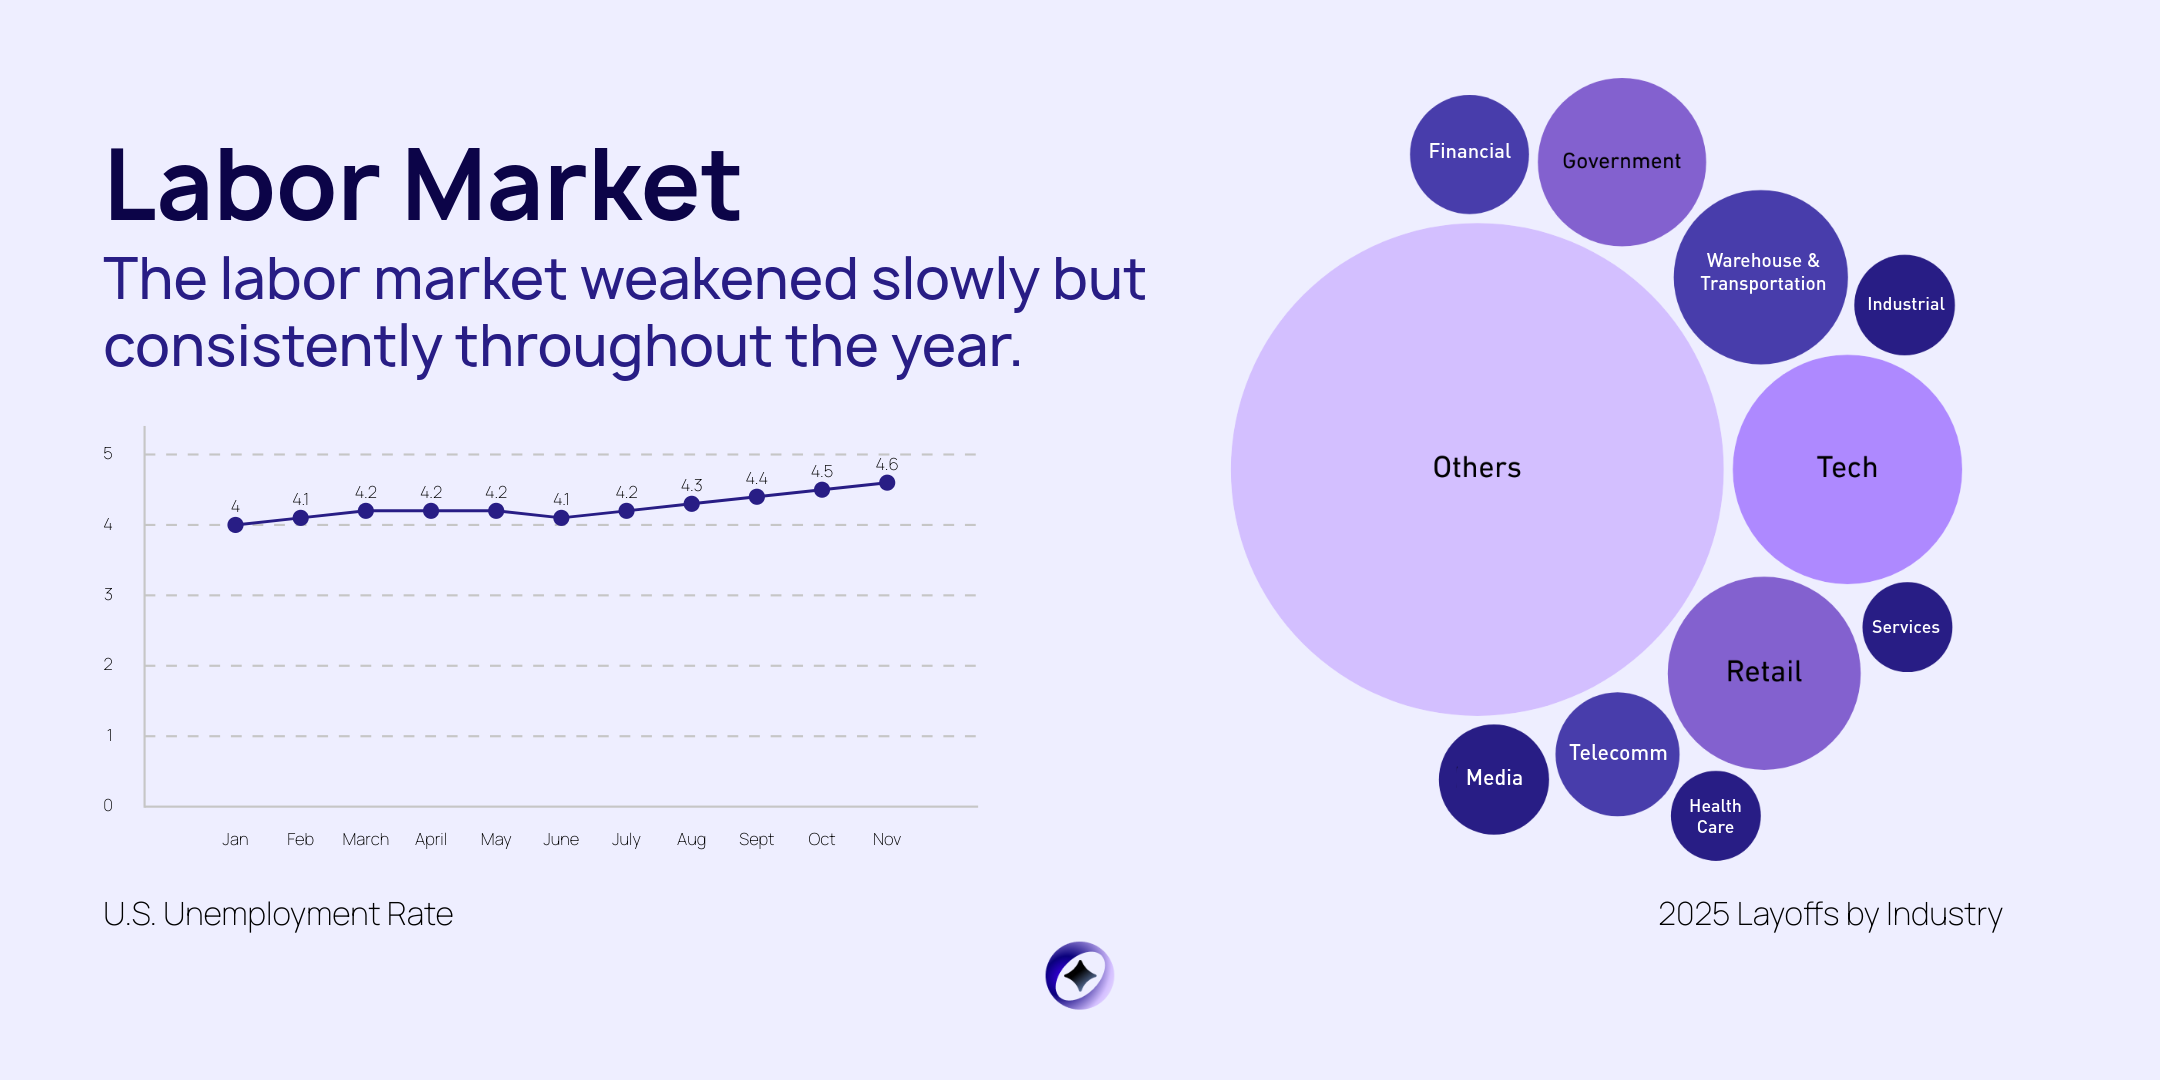
Chart 4: The Labor Market Softened Gradually
The labor market weakened slowly but consistently throughout the year.
Unemployment rose from 4.0 percent in January to 4.6 percent by November. There were no sudden spikes, but the direction was clear.
Rising unemployment often lags other indicators. By the time it shows up, demand softness has usually been present for months. This trend aligns with declining sentiment and helps explain why hiring plans changed and why revenue growth slowed in the second half of the year.
For small businesses, labor market shifts affect both sides of the equation. They influence consumer demand and change hiring dynamics at the same time.
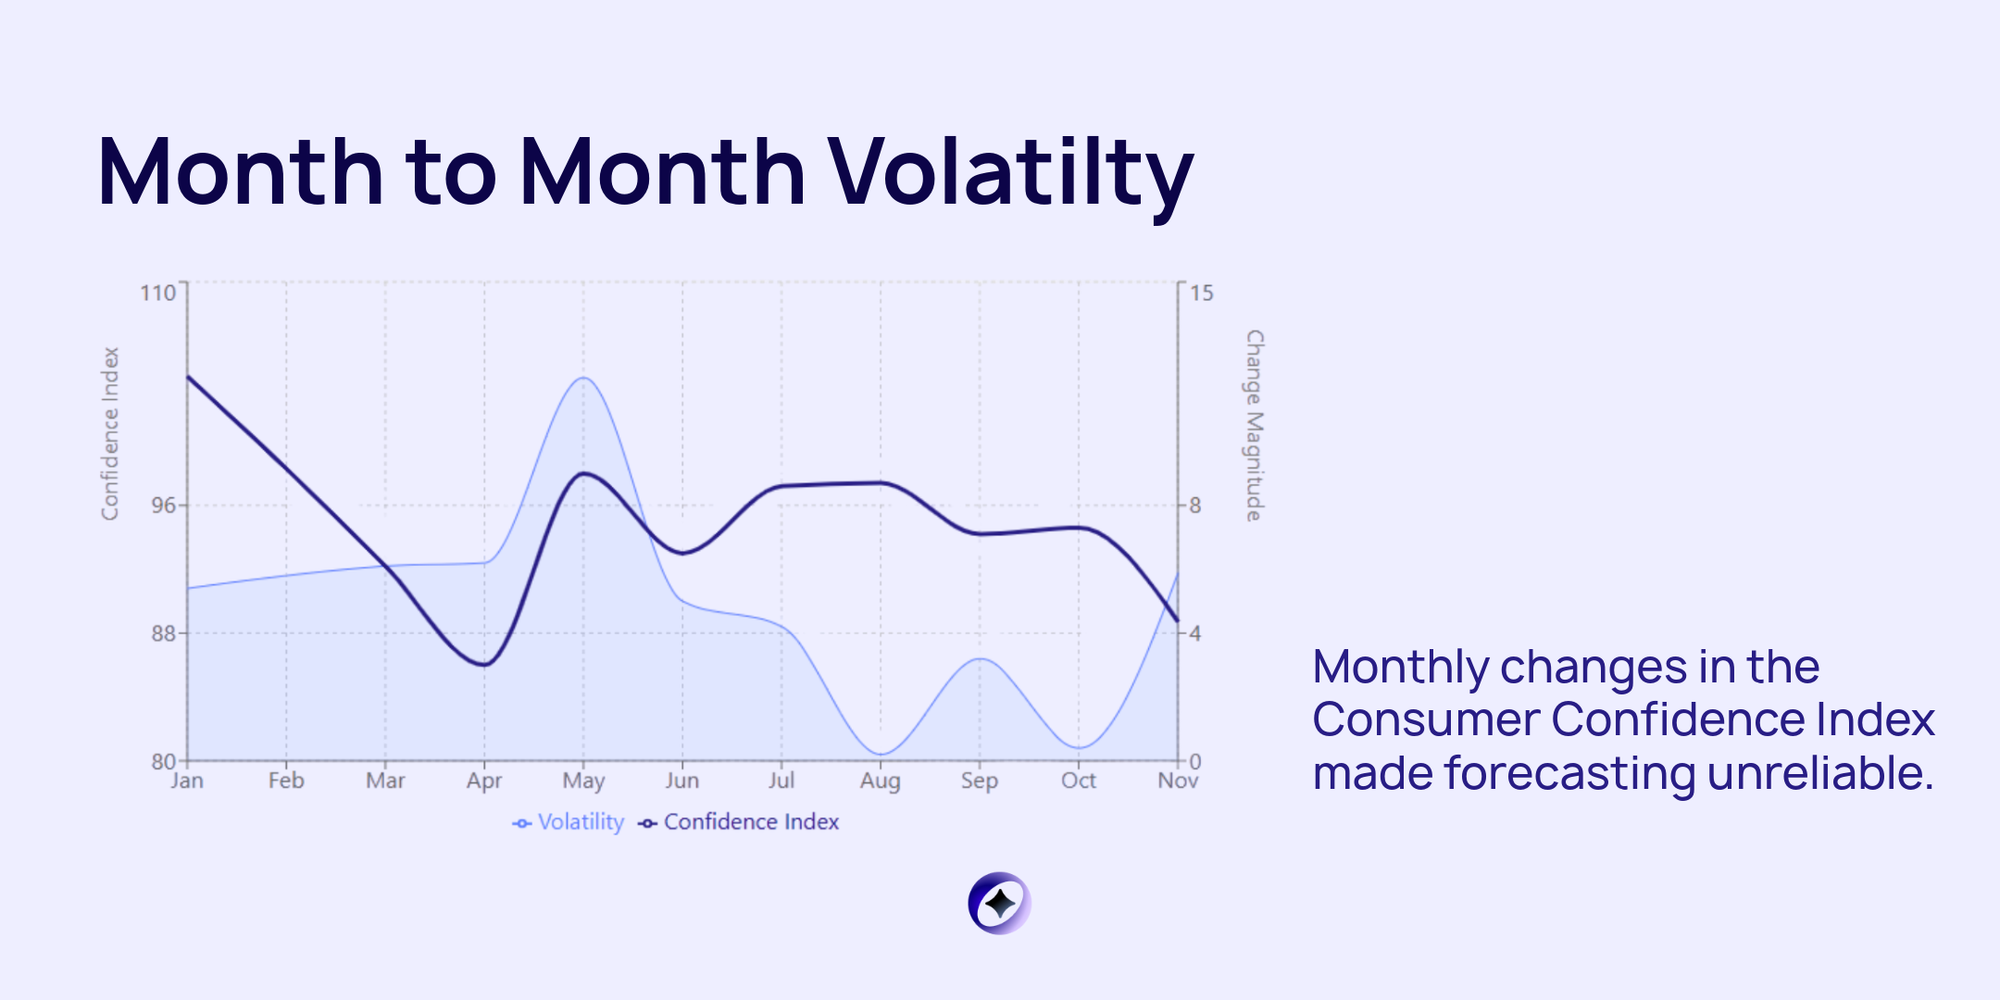
Chart 5: Month to Month Volatility Made Forecasting Unreliable
Looking only at index levels hides one of the biggest challenges of 2025. Volatility.
Monthly changes in the Consumer Confidence Index were large and frequent. February, March, and April each saw declines of more than five points. May jumped by 12 points. November fell by nearly six points.
This pattern matters because most forecasts assume gradual change. When indicators swing this much month to month, even well-constructed models break down.
For operators, this translated into plans that felt outdated almost as soon as they were finalized.
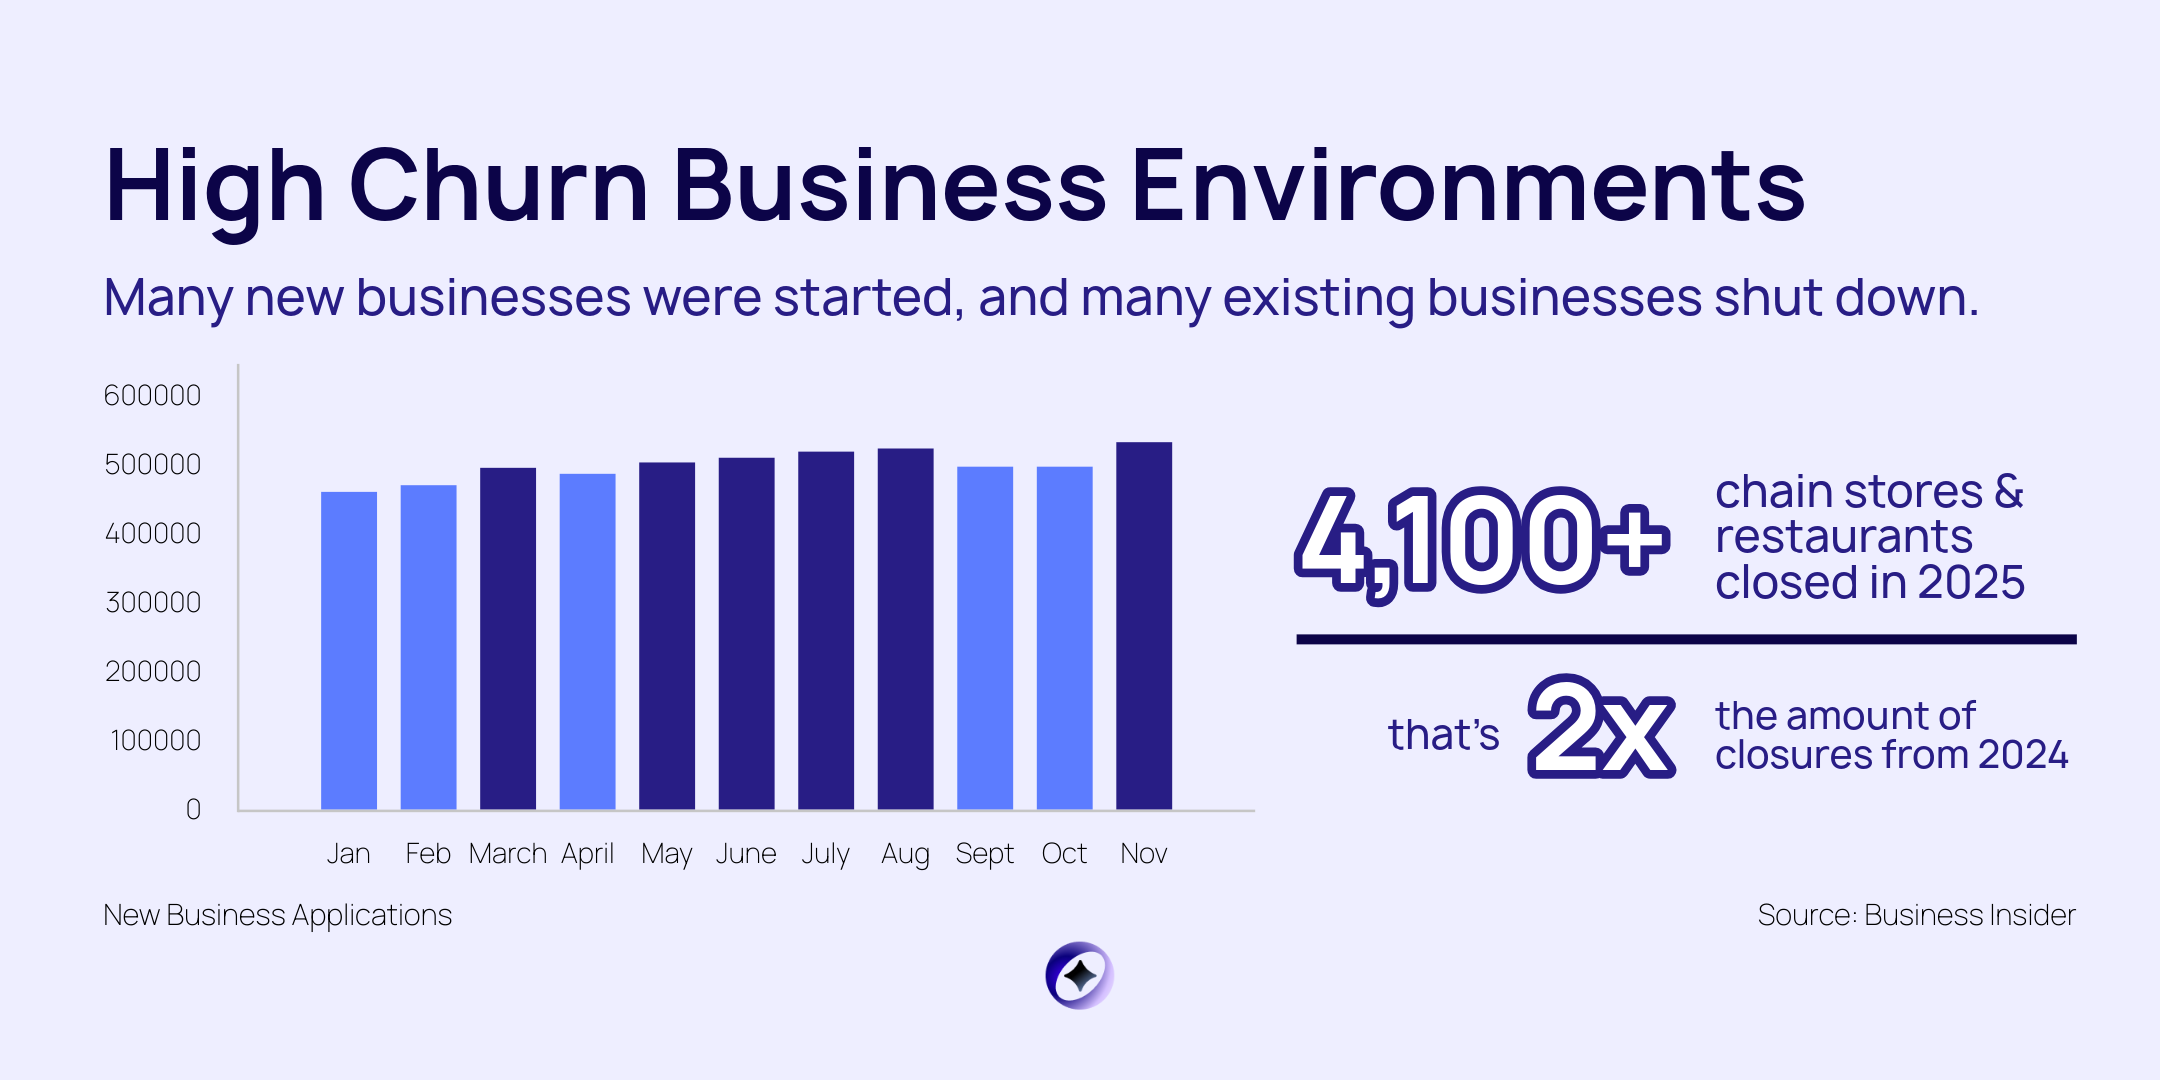
Chart 6: A High Churn Business Environment
Entrepreneurship activity remained strong on the surface. In November alone, there were 535,041 new business applications in the United States. From those applications, roughly 31,434 new employer businesses are projected to form within four quarters.
At the same time, more than 15,000 retail store closures were projected for 2025. Large chains accounted for a significant share, including 500 Walgreens locations, 370 Family Dollar stores, and 66 Macy’s stores.
This combination points to high churn. Many new businesses were started, and many existing businesses shut down.
For founders, this environment can feel confusing. Activity is high, but stability is low. Opportunity and risk increased at the same time.
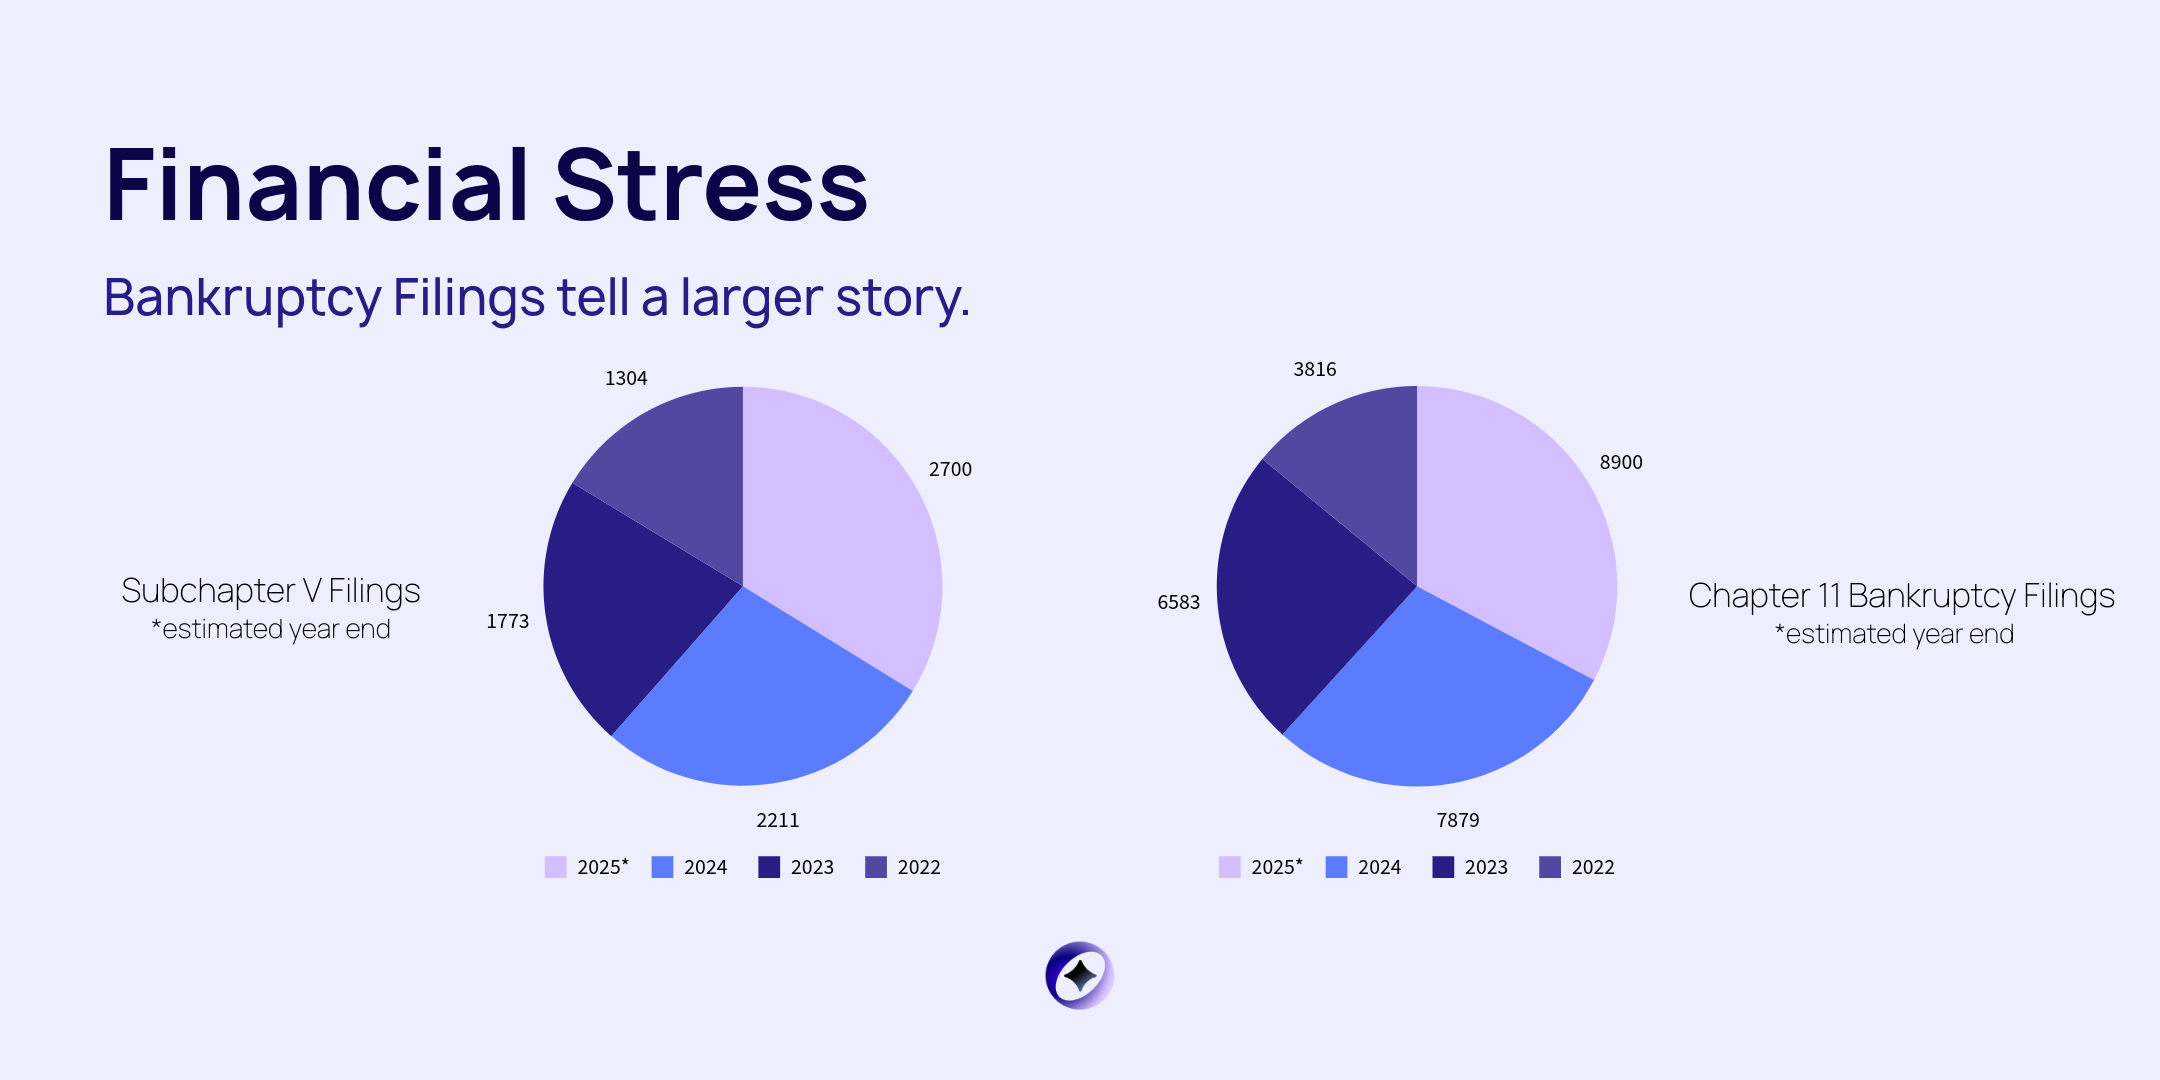
Chart 7: Financial Stress Became Hard to Ignore
Legal and financial stress showed up clearly in bankruptcy data.
From January through November 2025, there were 2,285 Subchapter V filings. Subchapter V is designed specifically for small businesses. Filings peaked in October at 248.
Commercial Chapter 11 filings told a similar story. There were 6,895 filings year to date, with a peak of 911 in July.
These numbers do not capture every struggling business, but they do show when pressure crossed a threshold. As the year progressed, more businesses moved from managing stress to confronting it directly.
Why Forecasts Failed in 2025
Looking across all seven charts, several patterns stand out.
Demand signals conflicted. Confidence rebounded while sentiment continued to fall.
Costs and capital moved on different timelines. Inflation cooled well before financing conditions improved.
Volatility was persistent. Month to month swings were large enough to invalidate assumptions quickly.
Stress accumulated slowly, then became visible. Bankruptcies and closures rose after months of softer demand.
None of this points to poor execution by individual founders. It points to an environment where traditional planning tools were poorly suited to the conditions.
What the Data Suggests for Planning Ahead
The 2025 data highlights a few practical takeaways.
Ranges matter more than point estimates. Single number forecasts struggled in a volatile environment.
Lagging indicators deserve attention. By the time stress appears in filings or unemployment data, it has usually been building for months.
Stability is a prerequisite for reliable growth planning. Without it, flexibility becomes more valuable than precision.
These are not emotional conclusions. They follow directly from how the indicators behaved throughout the year.
A Closing Note from Starcycle
At Starcycle, we work with founders at moments when plans change. Sometimes those changes are strategic. Sometimes they are forced by conditions that no forecast could fully anticipate.
The data from 2025 shows that many business decisions were made in an environment that shifted faster than planning cycles could keep up. That matters. It matters because it reframes how we evaluate outcomes. It matters because it creates space for honesty about what worked, what did not, and why.
Closure, pivots, and resets are not signs that something went wrong. Often, they are rational responses to real conditions. Understanding those conditions is part of finishing well and moving forward with clarity.
If 2025 felt harder than expected, the numbers explain why. And they remind us that how you respond to volatility is just as important as how you plan for growth.
When you are ready to think through next steps, whatever they may be, we are here to help you close one chapter cleanly so the next one can begin with fewer loose ends and more confidence.